
Ethereum Price Update Today – December 19, 2025
ETH/USD Technical Outlook
Date: December 19, 2025 | 11:50 AM UTC
📊 Market Overview
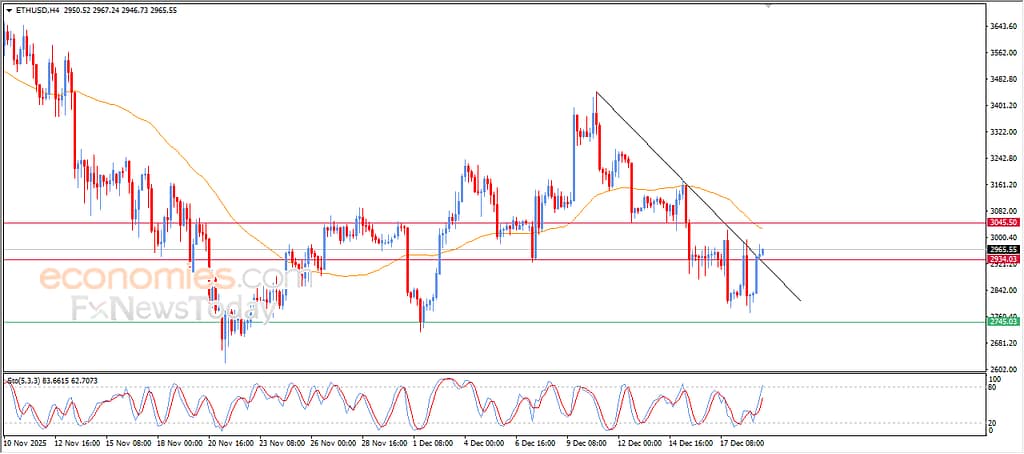
Ethereum (ETH/USD) posted modest gains during its latest intraday trading, successfully breaking above a short-term descending trendline, signaling an initial improvement in bullish momentum.
This upward move was supported by positive signals from the Relative Strength Index (RSI), reflecting a gradual return of buying interest after recent selling pressure.
Soybean Futures Close Lower for Fourth Straight Session Amid Technical Pressure – usanewstoday.net
⚠️ Ongoing Downside Pressure
Despite the short-term technical improvement, Ethereum continues to face notable bearish pressure, mainly due to:
- Trading below the 50-period Simple Moving Average (SMA)
- The lack of a confirmed strong bullish breakout
- The broader short-term trend remaining corrective in nature
These factors continue to limit the chances of a full recovery in the near term, keeping the current price action within a technical rebound rather than a confirmed trend reversal.
🔍 Technical Analysis & Outlook
- Short-term trend: Corrective bullish
- Key support: Recent rebound zones
- Key resistance: 50-period SMA, followed by prior swing highs
🔹 A sustained move above the broken trendline and the 50 SMA could open the door for further upside momentum.
🔹 Failure to hold above current levels may trigger a renewed test of nearby support zones.
📌 Conclusion
Ethereum is currently trading within a technically sensitive zone, balancing between recovery attempts and prevailing bearish pressure. While positive momentum indicators are emerging, they remain insufficient on their own to confirm a strong bullish reversal without additional technical confirmation.
Overall outlook: Neutral with a cautious bullish bias in the near term.

🎯 Upside Targets (Bullish Scenario)
If ETH/USD manages to hold above the recently broken descending trendline and attempts a move toward the 50-period SMA:
- Target 1: $2,360
(Near-term resistance and momentum test) - Target 2: $2,420
(Previous supply zone) - Target 3: $2,500
(Psychological level and strong technical resistance)
🛑 Stop-Loss Levels (Risk Management)
- Primary Stop-Loss: $2,260
(Break below short-term trend support) - Extended Stop-Loss: $2,200
(Failure of the rebound scenario / bearish continuation)
📌 Trading Summary
- Bias: Neutral → Cautiously Bullish
- Strategy: Buy pullbacks above support, protect below $2,260
- Risk-to-Reward: Favorable if price holds above trendline support
⚠️ Disclaimer
The information provided in this article is for informational and educational purposes only and does not constitute financial, investment, or trading advice. Cryptocurrency markets are highly volatile, and prices can fluctuate significantly within short periods of time.
Readers are advised to conduct their own research and consult with a qualified financial advisor before making any investment decisions. The publisher and authors are not responsible for any financial losses resulting from the use of the information contained in this article.